
Plotting AI/ML Activation Functions using Python
In AI/ML activation functions play very important role to training the neural network to classify data or predict the future information. There are different activation functions can be utilized to train the neural network.
Some of them are below e.g. Sigmoid, ReLU etc.
We need some libraries to plot these functions which are: matplotlib, numpy and math
Contents
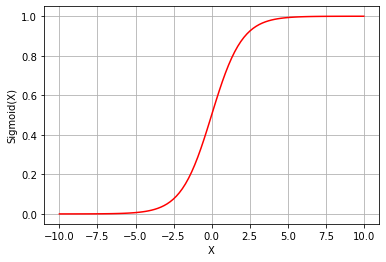
Plotting Sigmoid function using Python
f(x) = 1/(1+e^(-x))
Solution
# Sigmoid Function using Python
# Imporitng Libraries
import math
import matplotlib.pyplot as plt
import numpy as np

# Sigmoid Function
def f_sigmoid(x):
    return 1/(1+np.exp(-x))

# Giving Range for the function
x = np.linspace(-10,10,100)

# Calling Sigmoid Function
z = f_sigmoid(x)

# Plotting Sigmoid Function
plt.plot(x,z, color='red')
plt.xlabel('X')
plt.grid()
plt.ylabel('Sigmoid(X)')
plt.show()
Output Waveform
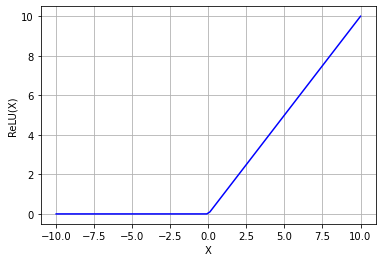
Plotting ReLU function using Python
f(x) = max(0, x) = 0, when x<0 and, =1 when x>0
Solution
# Relu Function using Python
# Imporitng Libraries
import math
import matplotlib.pyplot as plt
import numpy as np

# Relu Function
def f_relu(r):
    y = []
    for rr in r:
        if (rr<0):
            val = 0
        elif (rr>0):
            val = rr
        y.append(val)
    return y

# Giving Range for the function
x = np.linspace(-10,10,100)

# Calling ReLU Function
z = f_relu(x)

# Plotting ReLU Function
plt.plot(x,z, color='blue')
plt.xlabel('X')
plt.grid()
plt.ylabel('ReLU(X)')
plt.show()
Output Waveform
Post Tagged with : Activation Functions, AI/ML, Artificial Intelligence, Cosh, Deep Learning, Machine Learning, Neural Network, Prediction, Relu, Sigmoid, Softmax, Tanh, Training